


Prime London Sales & Lettings Market Report — Q2 2026

Copyright Thom Atkinson
Prime London is running on two tracks again, but they have swapped places since March 2026. Sales values are falling at their fastest rate since 2009, while rents are flat and homes are letting faster than a year ago. Underneath both sits a change of Prime Minister, a new tenancy regime and market speculation. This snapshot pulls out key actions so you can act on data, not guesswork.
What you need to know
Sales: more choice for buyers, and it shows in the price.
- Achieved prices across prime London fell 7.5% YoY to Q2 2026 — the steepest annual fall since 2009. Prime central London fell further at 9.0%.
- Average time on the market reached 186 days (up from 178).
- Average discounts widened from 8.3% to 10.4%.
- YTD sales volumes are down 11.4% YoY.
Supply is doing the work. Stock available at the end of June was 3.0% higher YoY, and ~66% above 2019 levels. Growth is driven by lower price bands, while £5m+ stock has thinned out.
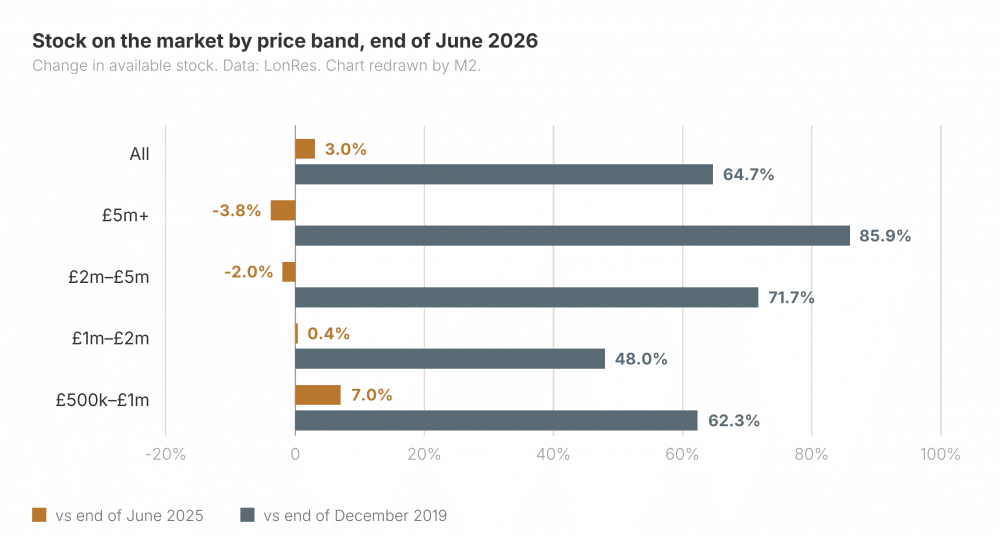
What this means for sellers. Nobody is being forced out, but sellers are waiting longer and settling lower. Holding out for an optimistic launch price accumulates costs on an empty flat — service charge, ground rent, insurance, utilities, and council tax — that often exceed the price adjustment needed to sell.
Launch realistically based on evidence, and have your legal and compliance pack ready before listing.
Lettings: rents flat, but the market is moving faster.
The rental index recorded -0.1% quarter and annually, but rents remain more than 35% above pre-pandemic levels. Average time to let fell from 65 days to 57 days, and asking rent discounts narrowed to 3.3%. Average prime London yields reached 4.82% in Q2 (vs 4.74% at end-2025).
What this means for landlords. Weighing a sale with a 10.4% discount against holding and letting is key. Well-presented flats are letting inside two months. Dated ones are not, and the new rules leave less room to fix a slow start.
The Renters’ Rights Act has changed the mechanics of letting.
The Act came into force on 1 May 2026. Bidding above the advertised rent is no longer permitted, consequently only 10.7% of prime London lettings achieved above asking in 2026 YTD, down 27.7% from 2022.
What this means in practice. The asking must be right on day one. The market can no longer bid up an initial figure, so pitching high just costs void weeks.
The £100,000 line runs straight through our patch. The Act does not apply where the annual rent exceeds £100,000 (£8,333/mth or £1,923/wk) — those remain common law tenancies. Across prime London, 12.1% of lettings this year sat above this threshold, rising to 21.5% in prime central London and > 40% in Mayfair and St James’s.
What this means for owners in SW3, SW5 and SW7. Larger lateral flats and houses sit close to this line. Which side of the £100k line a lease lands changes the notice regime, possession grounds and rent increase rules entirely. Check the written agreement before signing renewals.
The politics behind the numbers
Speculation is doing more damage than any actual tax. A new Prime Minister took office in July, bringing fresh conjecture about property taxation (including replacing stamp duty and council tax with a proportional property tax). None of it has been legislated. Historically, inflation-adjusted prime values have dropped under every government since the 2010–15 coalition.
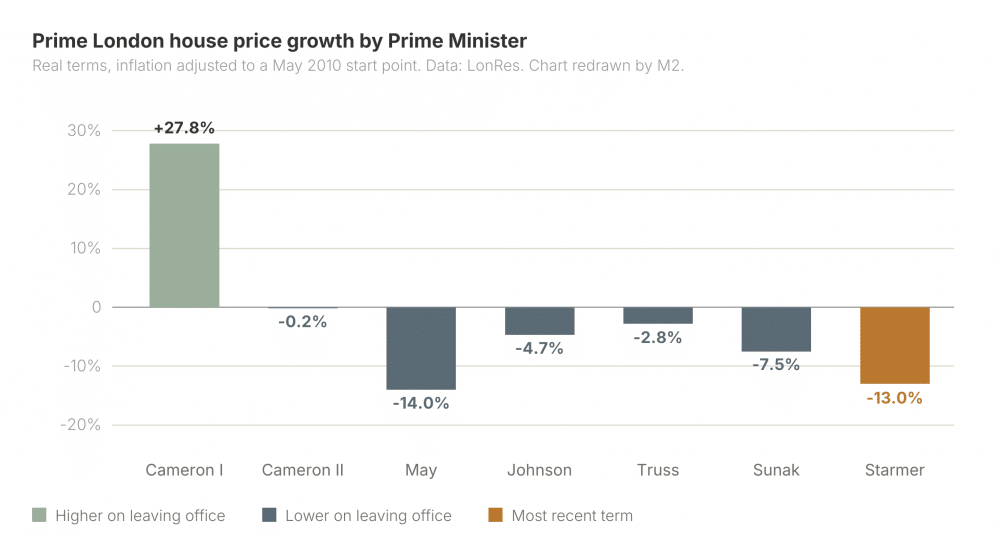
What this means for everyone. Discretionary markets stall when buyers and sellers are handed a reason to wait. Do not restructure ownership around a tax that does not yet exist — wait for the Autumn Budget and act on what is actually in it.
Key dates
Q2 2026 data window: April to June, with LonRes analysis running to 30 June 2026.
Renters’ Rights Act in force: 1 May 2026 — under one full quarter of data, so treat behavioural conclusions as provisional.
Next checkpoint: the Q3 update, and the autumn Budget. Until the Budget, tax commentary is commentary.

How to be ready
- Landlords: price to let, not to test. Fifty-seven days is the average, not the target. Benchmark rent against recent like-for-like lets in your building or street, and resolve small defects before the photographs.
- Landlords: check where your rent sits against £100,000. If a renewal or new letting lands within a few thousand pounds either side of the threshold, take advice before anyone signs.
- Sellers: budget for the void honestly. At 186 days, standing costs on an empty flat stop being a rounding error. Build them into your reserve price rather than discovering them in month five.
- Sellers: have compliance ready before you list. EICR, EPC, alarms, lease and service charge figures. Buyer scrutiny rises when buyers have choice.
- Buyers: use time-on-market intelligently. On flats that have sat for months or been reduced, negotiate firmly based on local data.
- Everyone: measure, don’t guess. Compare against 3-4 recent, similar transactions within a short walk. If your number sits well above those, expect a long wait or reduction.
Still have questions?
My tenancy is close to £100,000 a year. Does the Renters’ Rights Act apply?
It turns on the annual rent stated in the agreement, not the property value. Above £100,000, it is a common law tenancy and falls outside the Act; at or below it, the Act applies in full. Because the threshold is a cliff edge, check the figure before signing a renewal.
Should I sell now, or let and wait?
That is a judgement about your individual circumstances. Data shows sales are taking longer and discounting more deeply, while lettings move faster than a year ago at yields of around 4.8%. We are happy to talk through specific property figures.
Will the proposed property tax changes affect me?
Nothing has been legislated. Proposals circulating are commentary, and market hesitation stems from speculation. We will report on whatever appears in the autumn Budget once published.